I’m not a huge sci-fi guy, generally preferring horror, but I was intrigued by the plot of V so I decided to buy the 2009 reboot on Apple TV and was very impressed, especially by the choice of the lead actress who despite her beauty, reminds me so much of a snake.
The plot:
Earth is visited by space ships full of aliens. Each ship hovers over major cities like New York, Paris, Beijing, etc as people look up at bottom of the ships which form a massive TV screen from which the beautiful Anna explains that they come in peace and promises to share their advanced technology.
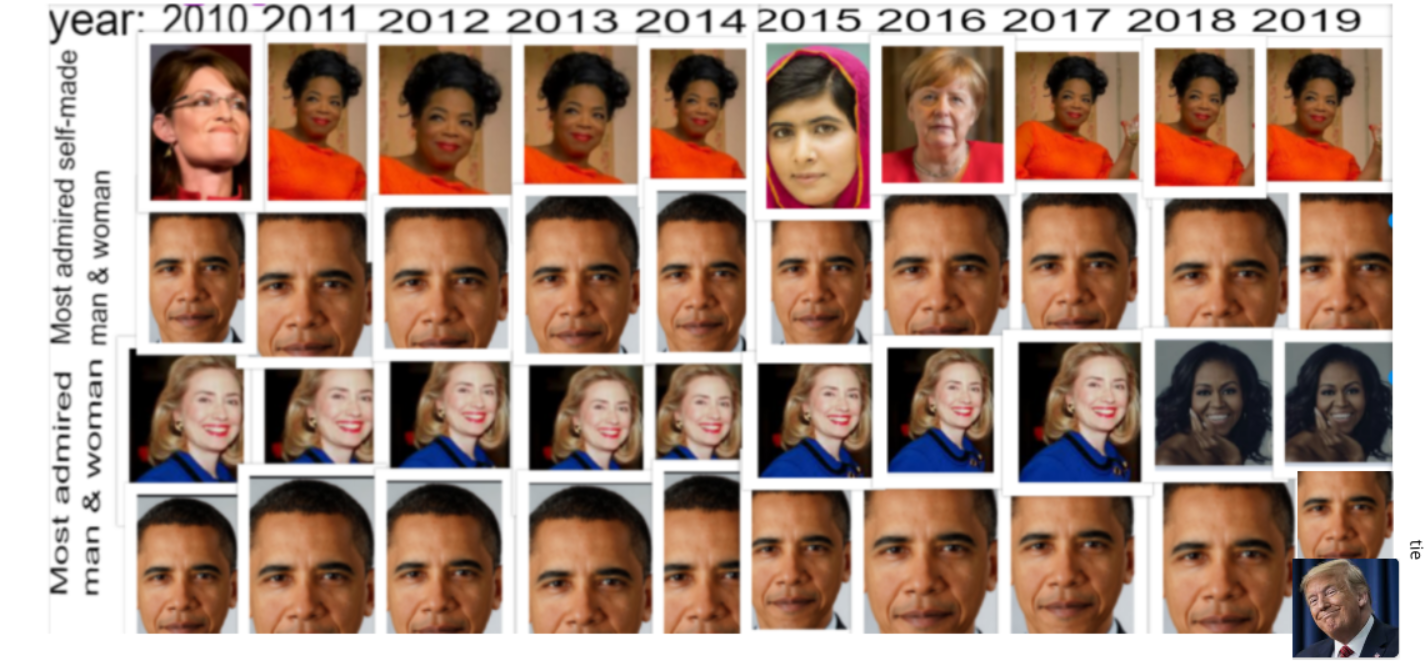
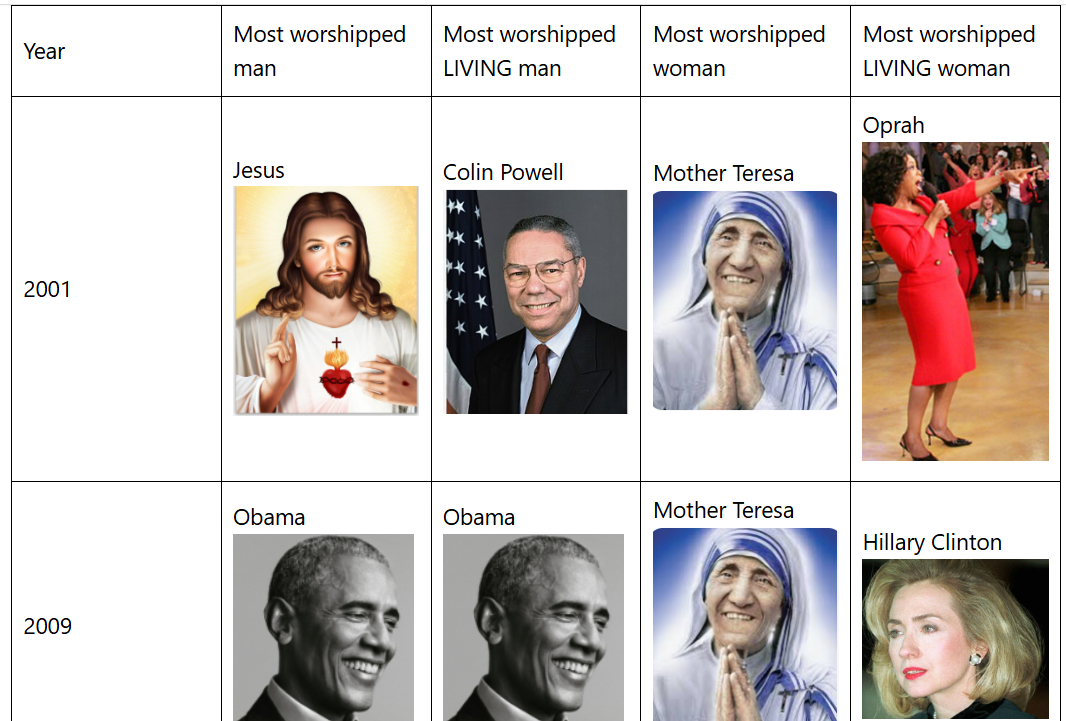
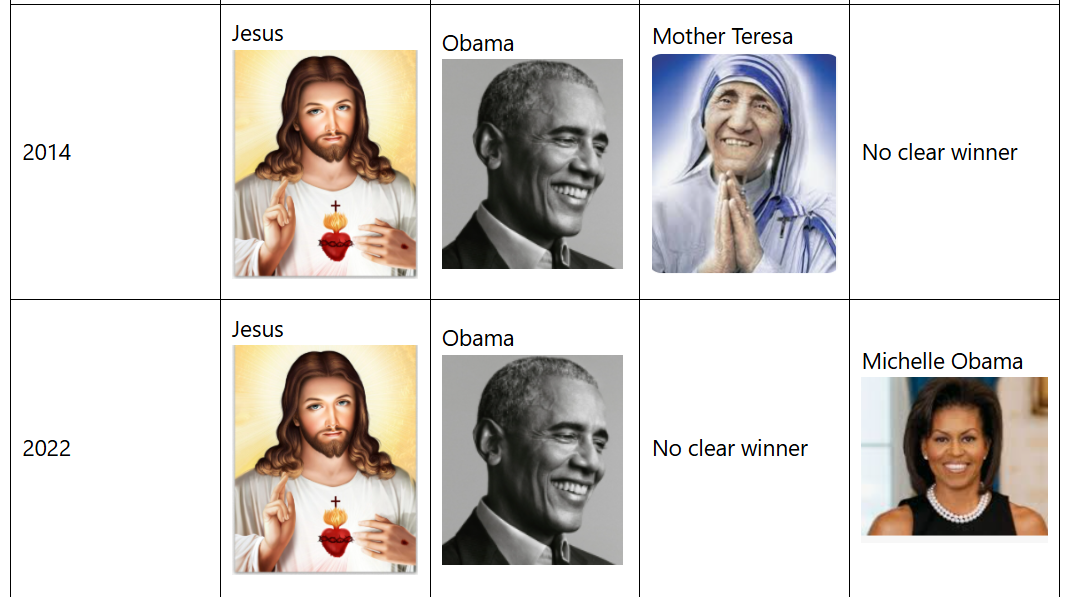
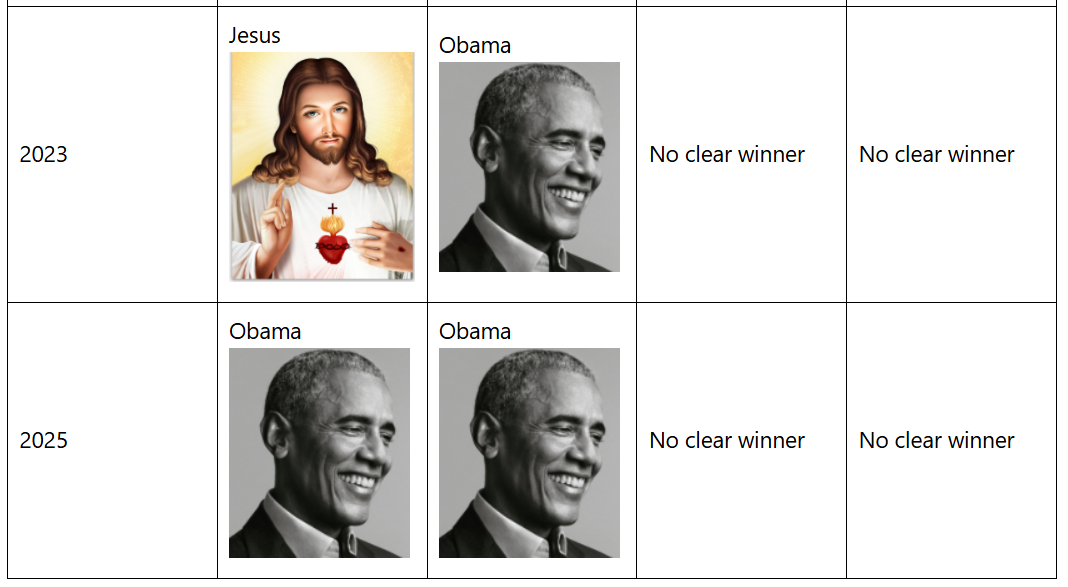
Because people look up to this huge image of a face constantly talking to them from the sky, Anna is like God. Anna quickly becomes a beloved figure on the World stage, meeting with World leaders and charming the masses with jokes like “not even us Vs can cure the common cold”. She would have towered as the most admired woman in the World on the annual Gallup poll of Americans (or any other nation).
When skeptics ask how it’s possible that aliens on another planet just happened to evolve to look and act identical to humans Anna says “our scientists can explain” which they never do because beneath the cloned human skin they actually look like reptiles and like a snake, Anna can opens her mouth wide enough to swallow her sexual partners after using them to fertilize her thousands of eggs which she needs to build her army, since the rest of her space ships are taking too long to get to Earth.
Sadly the show only lasted two seasons and since this is a reboot of the hit 1983 series by the same name, many fans of the original didn’t give it much of a chance.